CUSTOMER ANALYTICS
Customer Shopping Behavior
What shapes customer spending and subscription behaviour?
3,900 purchases · Portfolio case study
The question & data
A connected Python, SQL, and Power BI workflow exploring purchasing patterns, customer segments, and product preferences.
3,900 purchase records across 18 source fields. Each row combines customer attributes with a recorded purchase.
The approach
- Imputed 37 missing review ratings with category medians and standardised column names.
- Created quantile-based age groups and mapped purchase frequency into days.
- Used CTEs, aggregations, and window functions to investigate subscriptions, discounts, and product rankings.
What the work reveals
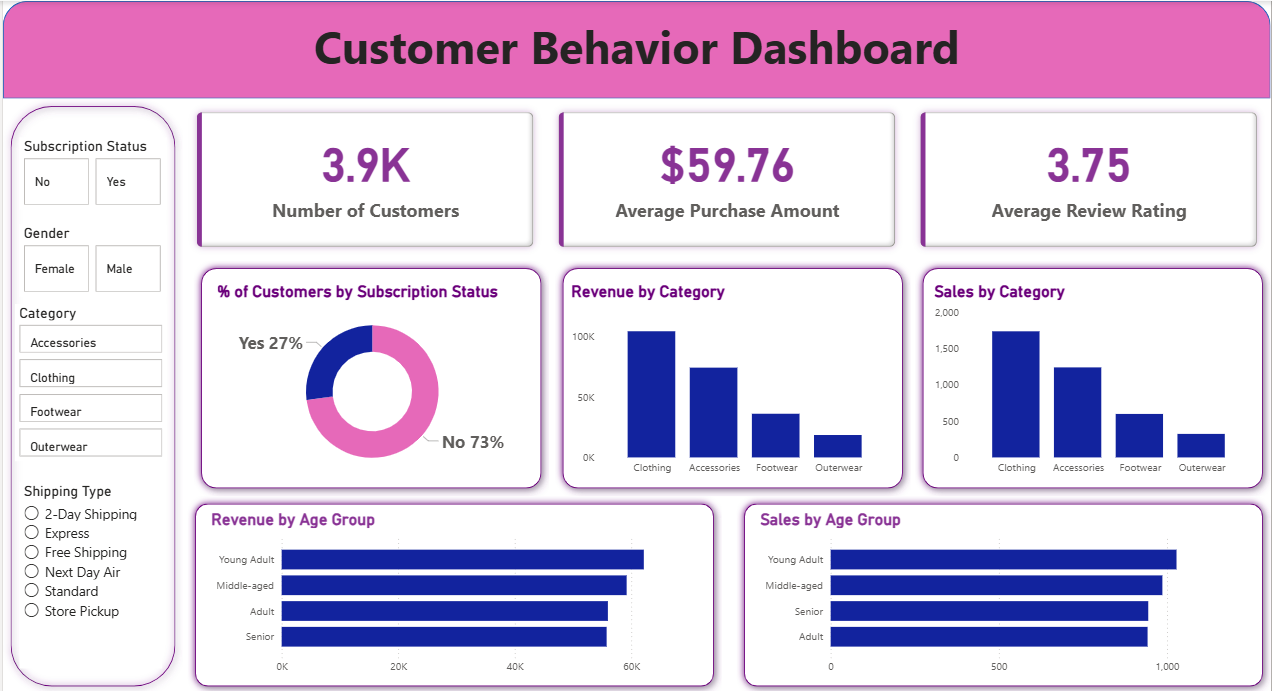
Subscribers represent 27% of the records (1,053 of 3,900).
Recorded purchase amounts total $233,081, with an average of $59.76.
From findings to next steps
Test subscription messaging with repeat customers, and evaluate discounts alongside margin data before changing promotional policy.
Read the results in context
The data describes observed purchases, not the causal effect of subscriptions or discounts. Age groups are dataset-derived quartiles.
Explore the SQL implementation
--Q1. What is the total revenue generated by male vs. female customers?
select gender, SUM(purchase_amount) as revenue
from customer
group by gender


--Q2. Which customers used a discount but still spent more than the average purchase amount?
select customer_id, purchase_amount
from customer
where discount_applied = 'Yes' and purchase_amount >= (select AVG(purchase_amount) from customer)


-- Q3. Which are the top 5 products with the highest average review rating?
select item_purchased, round(avg(review_rating::numeric),2) as "Average Product Rating"
from customer
group by item_purchased
order by avg(review_rating) desc
limit 5

--Q4. Compare the average Purchase Amounts between Standard and Express Shipping.
select shipping_type,
ROUND(AVG(purchase_amount),2)
from customer
where shipping_type in ('Standard','Express')
group by shipping_type;

--Q5. Do subscribed customers spend more? Compare average spend and total revenue
--between subscribers and non-subscribers.
SELECT subscription_status,
       COUNT(customer_id) AS total_customers,
       ROUND(AVG(purchase_amount),2) AS avg_spend,
       ROUND(SUM(purchase_amount),2) AS total_revenue
FROM customer
GROUP BY subscription_status
ORDER BY total_revenue,avg_spend DESC;

--Q6. Which 5 products have the highest percentage of purchases with discounts applied?
SELECT item_purchased,
       ROUND(100.0 * SUM(CASE WHEN discount_applied = 'Yes' THEN 1 ELSE 0 END)/COUNT(*),2) AS discount_rate
FROM customer
GROUP BY item_purchased
ORDER BY discount_rate DESC
LIMIT 5;


--Q7. Segment customers into New, Returning, and Loyal based on their total
-- number of previous purchases, and show the count of each segment.
with customer_type as (
SELECT customer_id, previous_purchases,
CASE
    WHEN previous_purchases = 1 THEN 'New'
    WHEN previous_purchases BETWEEN 2 AND 10 THEN 'Returning'
    ELSE 'Loyal'
    END AS customer_segment
FROM customer)

select customer_segment,count(*) AS "Number of Customers"
from customer_type
group by customer_segment;

--Q8. What are the top 3 most purchased products within each category?
WITH item_counts AS (
    SELECT category,
           item_purchased,
           COUNT(customer_id) AS total_orders,
           ROW_NUMBER() OVER (PARTITION BY category ORDER BY COUNT(customer_id) DESC) AS item_rank
    FROM customer
    GROUP BY category, item_purchased
)
SELECT item_rank,category, item_purchased, total_orders
FROM item_counts
WHERE item_rank <=3;

--Q9. Are customers who are repeat buyers (more than 5 previous purchases) also likely to subscribe?
SELECT subscription_status,
       COUNT(customer_id) AS repeat_buyers
FROM customer
WHERE previous_purchases > 5
GROUP BY subscription_status;

--Q10. What is the revenue contribution of each age group?
SELECT
    age_group,
    SUM(purchase_amount) AS total_revenue
FROM customer
GROUP BY age_group
ORDER BY total_revenue desc;
Based on supplied portfolio materials. Findings describe the dataset and report; recommendations are proposed next steps, not measured business outcomes.